


SAP BPC users know that its user interface is built on the Excel platform – making it user-friendly for accounting and finance professionals who already work in Excel for financial statements and other reporting. But how can you improve the Excel experience, either with or without a developer?
There are many answers to that question, depending on your budget and your BPC users’ experience. Let’s start with four ways to improve the Excel experience using your company’s existing resources.
1. Use EPM Formula-Based Reports Instead of Dynamic (expansion) Reports
BPC and the EPM Add-in come with two powerful tools for creating Excel-based reports (also in addition to a web-based reporting interface):
- EPM Reports – which use an editor or drag and drop to build reports
- EPM Formula-Based Reports (e.g. EPMRetrieve)
EPM Reports are often the recommended approach due to their scalability in high-volume reports, but they do have a few downsides:
- Learning Curve – due to many EPM options, local members, etc.
- Formatting – some users find the formatting sheet is overwhelming and unintuitive.
- Excel Formulas – formulas require the use of complex local members.
- Performance – multiple EPM reports on a single template can perform poorly on small datasets.
There is a time and a place for both techniques and understanding when to use each is critical to a successful BPC implementation. For relatively small summary reports, use EPMRetrieve reports as a straightforward way to improve the look and feel of your templates while making them easier for new BPC users. Some other benefits are:
- EPMRetrieve reports give users the ultimate control to create financial statements with the exact look and feel required by management. You can format with native Excel formatting and conditional formatting as required, insert rows and columns without local members and perform manual calculations directly by row or column (e.g., gross margin percentage, variance calculations, etc.)
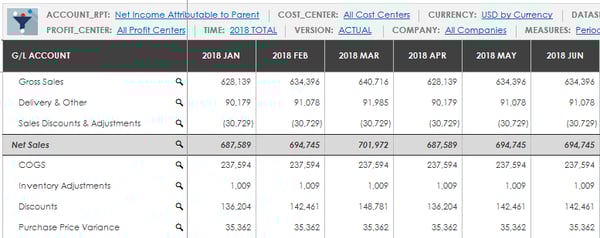
- Users can create a EPMRetrieve report with little EPM report writing knowledge. For example, an EPM report could easily take over a week to build and get the formatting just right where most “static” reports can be built in a few hours. Excel-savvy users can learn to build these reports very quickly versus EPM Reports that take longer to master.
- In reports with limited rows and columns, refresh times can be extremely fast compared to standard EPM reports.
- Fixed/Static Report (EPM Formula) uses:
- Financial statements and highly formatted reports
- High-level, summarized reports
- Low cell count, smaller reports (<5k)
- **Unlike dynamic EPM reports, if the presentation of a certain financial statement is changed, the report would have to be manually updated. **
- Dynamic (EPM Reports) uses:
- Reports with granular details in the body of the report that could change based on parameters (example: reports with detail products, GL accounts, cost centers, etc. in the rows)
- High cell count, larger reports (>5k)
- Fixed/Static Report (EPM Formula) uses:
2. Use of Excel Dashboards
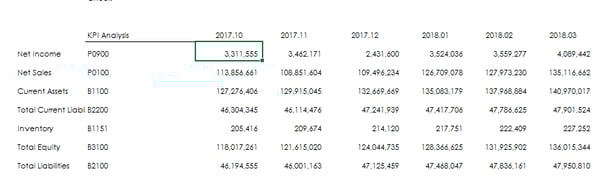
Excel dashboards can easily be created with native Excel functionality (charting). Data can be retrieved into a worksheet using EPMRetrieveData and manual calculations done using sheet logic for any KPI required. Excel provides a large inventory of charts to assemble a “dashboard” look and feel. BPC enhances the dashboards by automatically updating the as the report is refreshed. An effortless way to begin a chart is to use the selection from the Excel ribbon as shown below:

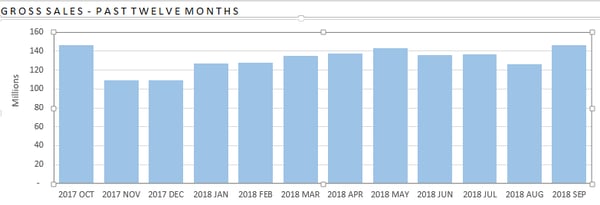
The below example demonstrates retrieving data by month to create a bar chart. This data can be retrieved on the same worksheet as the graph or in a separate hidden worksheet as necessary.
The below graph was created from retrieving sales data from BPC for the last twelve months.
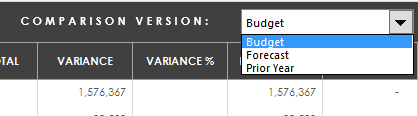
3. Use Drop-Down Selectors in Reports
- Utilizing drop-down selectors in reports rather than choosing dimension IDs from the EPM context pane allows users to curate the list of available selections. For instance, a drop-down selector can narrow down the version list in a variance report, allowing users to select Budget or Forecast to compare against actuals.
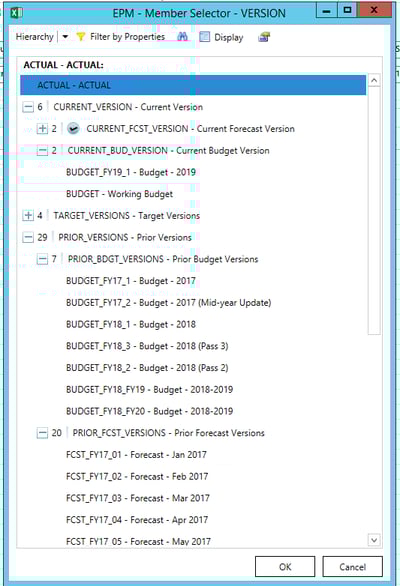
users could just select from this…
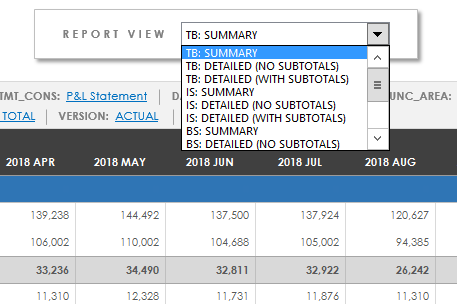
- Utilize drop-downs based on another user selection (other drop-down). An example of this is a template where the user selects a cost center member using a drop-down, then narrowing down the accounts in a separate drop-down based on the cost center selected.
- Use drop-downs based on zero suppressed data in a report. Suppressing data using a drop-down selection of “yes” or “no” enables the user to control the granularity of the report without having to learn complex BPC expansion syntax.
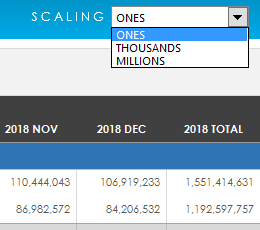
- A drop-down can be used to choose the scaling view of the data on a report:
- Utilize a drop-down coupled with an EPM formula, such as EPMDimensionOverride, to create custom, dynamic views for report rows.
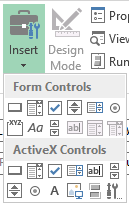
4. Use Excel Buttons for Sending and Refreshing Data
Using Excel buttons or forms works great in BPC templates. Instead of using the EPM ribbon icon to send or refresh data, a button can be placed directly on a report. The user doesn’t have to search in the EPM Add-in ribbon to save or retrieve data from BPC – the button is clearly visible and one click will either save or retrieve data.
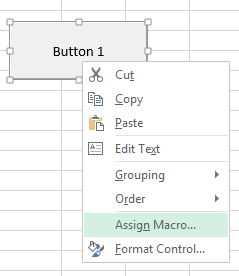
To insert a button, navigate to the Developer tab in the Excel Ribbon and choose “insert,” then click to see the options available for buttons (forms).
Once the form is added, assign an EPM API as a macro to either send or refresh data. The most common API’s used on buttons are RefreshActiveReport, RefreshActiveSheet, SaveWorkbookData, and SaveWorksheetData
Stay tuned for next week’s blog – How to Improve the BPC User Experience, Part Two: With a Developer.
Related Content

Author Bio:
Jennifer Breier is a Product Manager for Darwin EPM, working on the Revenue and Reporting team and focusing on Consolidations. Jennifer has over 20 years of experience in Financial Consolidation, Operational Planning, and Analytical Reporting. She has been working with BPC for over 15 years. Her experience includes SEC reporting, mergers and acquisitions, internal and external reporting, consolidations, and budgeting.