After my last blog post, How to Improve the SAP BPC User Experience, Part One: Without a Developer, I’d like to share five ways to improve it WITH the help of a developer!
A developer can assist in enhancing your BPC experience, as they have seen a variety of ways to utilize BPC across companies and can apply different ideas to improve your BPC interface. In addition, based on our experience, Darwin EPM has created tools to improve the Excel interface, as well as the experience for BPC users and administrators.
1. Utilize an Add-in as a Navigation Tool in Addition to the EPM Add-in

Navigation, especially for first-time SAP BPC users, can sometimes be frustrating, even for basic things like finding the right place to enter data or run a report. The screenshot above is an Excel add-in (like the EPM Add-in) with quick access shortcuts to models, templates and data manager packages. This add-in ribbon provides easy-to-reach action buttons to refresh data, send data, show logs, etc.
2. Create a “Sidebar” in the Template

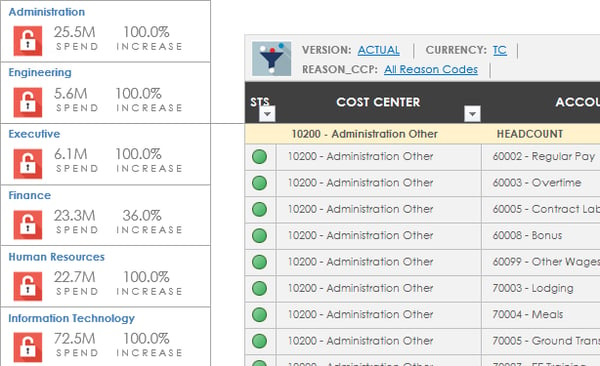
Large, nested row reports can become taxing on the system when building templates, causing it to take longer to refresh upon changing a context member. If users need to run the same report for various cost centers or entities, it can be frustrating to refresh after each context update. In this example, a “Sidebar” is created on the left side of the report, allowing quick and easy filtering of the rows within a report without triggering a refresh from the database. It also gives the template a more robust, consumer-grade application, look and feel. In addition to filtering, a sidebar can contain template-specific KPI’s and links to commonly performed tasks such as locking or unlocking work status (lock icon in example above).
3. Utilize Menus to Organize Sections of Your Template

Over the years, we’ve come across many large input templates and reports with too many columns to fit on a single screen. This requires a lot of scrolling, making it difficult for end-users to navigate. Improve usability by adding menus to templates; in the example above, we are using Excel shapes to create menu items controlling the columns that are displayed. Users can quickly jump to different sections of the template without scrolling or triggering a refresh of the template. The VBA is relatively simple for this task (hiding and unhiding columns) but makes a significant difference in usability.
4. Customize the Dimension Context Selector

We’ve heard many times that knowing exactly the data intersection you’re looking at and making selections for each dimension in your model can be both confusing and time-consuming. The Context Selector shown above allows users to select the member IDs for a template directly above the data retrieval section rather than using the EPM context pane. This allows the user to quickly select the intersection for each template and is customizable to display which dimensions are selectable on the template. Another benefit of having the selector directly above the template is that all your context selections will be visible when printing the template. The selections are in-sync with the EPM context pane – making it easier to navigate and customize.
5. Utilize a Process Flow Developed in Excel

BPC Business Process Flows (BPF’s) are often criticized, with many organizations much preferring the old OutlookSoft Custom Menus that were built into Excel. If most of your processes are built using Excel input templates and reports, jumping back and forth between web BPF’s and Excel templates can feel a little disjointed for end-users. The BPF approval mechanism is also difficult to work with in planning scenarios and is rarely used in a production environment.
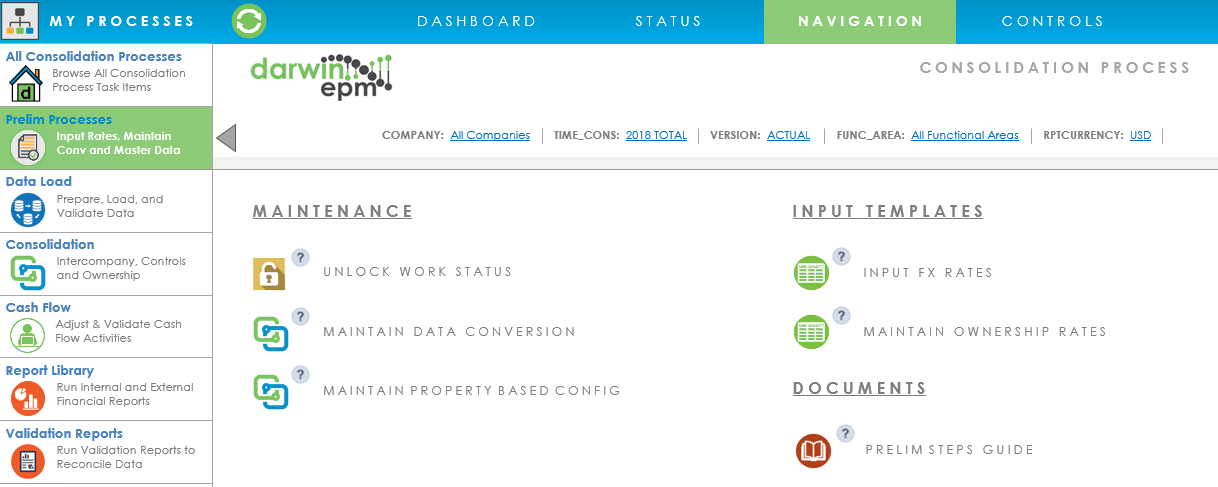
Most organizations want a straightforward way to navigate the planning process without having to dig for planning templates and reports. Building an Excel-based process flow is an excellent option for these organizations. We use the EPMPathLink formula or the EPM API (faster) to link to templates across multiple models from a single Excel menu. Since it is built in Excel, users have much more control over the look and feel and can embed things, including help file links to assist users with their questions. In the example above, we’ve used icons to link to input templates, reports, and data manager packages.
There are many ways to improve your BPC user experience with tools available in native Excel. Whether you use your own team or engage a third-party developer to enhance your users’ experience, know that there are a variety of tools available to help create a more robust BPC environment. The examples shown in this blog come from the Darwin EPM product for BPC where all the work has already been done to provide an optimal end user Excel-based experience. If you’d like to discuss any aspect of BPC or BPC user experience, let us know how we can help!
Related Content
- How to Improve the BPC Experience Part One: Without a Developer
- How to be a BPC Capital Planning Jedi Master

Author Bio:
Jennifer Breier is a Product Manager for Darwin EPM, working on the Revenue and Reporting team and focusing on Consolidations. Jennifer has over 20 years of experience in Financial Consolidation, Operational Planning, and Analytical Reporting. She has been working with BPC for over 15 years. Her experience includes SEC reporting, mergers and acquisitions, internal and external reporting, consolidations, and budgeting.

